People Indicators
 A sustainable population is one that continues to grow and nurture happy, healthy and contributing members. Education, recreation, health care, safety, culture and the arts all help individuals and groups continue to grow in ways that make them better citizens as well as better family members.
Demographics
- Population by Age
- Indicator: Leon County Population by Age
- Data Source: Office of Economic Vitality http://www.oevforbusiness.org
- Data Points:
 Loading…
- Observations: Leon County has the second highest percentage of population in the 18-24 age group in the state, reflective of the two state universities, community college and private post-secondary institutions in the area. The county also has the smallest percentage aged 65 and above in the state, but this is the fastest growing group percentage wise in the community.
Date Posted: November 16, 2020
- Population by Race
- Indicator: Leon County Population by Race and Ethnicity
- Data Source: Office of Economic Vitality www.oevforbusiness.org
- Data Points:
Loading…
- Observations: In 2019 data, Leon County population was 63% White, 33% Black and 4% Other. Leon County longer reflects the overall state racial and ethnic diversity due to the smaller percentage of Latino or Hispanic (6.5% vs. 23.6%) and greater percentage of Black or African American (33% vs. 16.7%).The 0-4 and school age population is significantly more diverse than the overall population in the county with approximately 45% Non-White. The over 55 population is significantly less diverse with 22.7% Non-white.
- Date Posted: 11/23/2020
- Population Change
- Indicator: Growth rate for Leon County and City of Tallahassee populations
- Data Source: www.talgov.com/planning/planning-support-stat-digest14.aspx
- Data Points: Population Estimates (1930-2014) show the City of Tallahassee growing from 150,624 in 2000 to 185,784 in 2013. The County as whole grew from 239,452 to 281,292 in that time period for an average annual increase of approximately 1.3% per year. Components of Population Change (2010-2013) show a total county wide increase of only 2890 over that period with a natural increase of 4076 (births – deaths) reflecting a net migration of minus 1,186.
- Observations: City of Tallahassee and Leon County as a whole have shown only modest increases in population over the last 14 years. While the state of Florida had a net in-migration increase of over 330,000 in the last four years, Leon County benefited little from that growth. Current projections do not reflect a significant increase in the rate of population growth for the community. A large factor in the explanation for the lower growth rate is the large graduating student population that annual leaves the area searching for jobs or continuing education and lack of economic development in the area. Date Posted: June 2014
- Higher Education Enrollment
- Indicator: Fall Enrollment at Area Institutions of Higher Learning (1960-2013
- Data Source: www.talgov.com/planning/planning-support-stat-digest14.aspx
- Data Points: From the year 2000 to 2013 Florida State University has grown from 34,485 to 41,447 students. Tallahassee Community College had increased from 11,207 in 2000 to 15,388 in 2011 and dropped to 13,634 in 2013. Florida A&M University was at 12,161 in 2000, reached a high point of 13,277 in 2010, and has declined to 10,743 in 2013.
- Observations: With the addition of Lively Vo-Tech and private post-secondary institutions, nearly 70,000 college age students are attending school in Leon County, representing 25% of the overall county population. FAMU and TCC’s drop in enrollment reflected changes in administration and admission standards as well as increasing opportunities in the workforce or at other institutions.
- Date Posted: June 2014
- Single Family
- Indicator:
- Data Source: www.talgov.com/planning/planning-support-stat-digest14.aspx
- Data Points:
- Observations:
- Homelessness
- Indicator: Point in Time Homeless Survey
- Data Source: 2015 Report on Homelessness in Leon County www.bigbendhc.org
- Data Points:
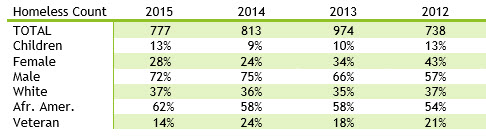
- Observations: A point in time survey cannot identify all the homeless in a county as large as Leon. It does provide a snapshot of the overall homeless population. The trend of the last three years has been fewer numbers in total, with slightly more children and minorities and fewer veterans. Efforts to provide assessment, assistance and transitional housing seemed to have had an impact. Opening of additional facilities and services in 2015 may impact the numbers further, but will certainly expand the community’s ability to help the homeless veteran, family and individual.
- Date Posted: March 26, 2015
- Submitted by: Jim Croteau jmcroteau@hotmail.com
Education
- Educational Attainment
- Indicator:
- Data Source:
- Data Points:
- Observations:
- Date Posted:
- School Readiness
- Indicator:
- Data Source:
- Data Points:
- Observations:
- Date Posted:
- College Preparedness
Loading…
- School Accountability Grades
- Indicator: School Accountability Grades (2012-2014)
- Data Source: http://www.leonschools.net/Domain/69 A spreadsheet for viewing school grades are available for download on this page.
- Data Points: 2014 State Accountability results in mathematics, reading and writing at the elementary level resulted in six Leon County schools with an “A” grade, five with a “B”, eight with a “C” and four with a “D”. Middle school grades for non-charter schools included five “A” schools, two schools with a “B” grade and two with a “C”. Charter school grades included one “A”, two “C” and two “D”.
- Observations: All of the A rated elementary schools are located north of Interstate 10, with the exception of Buck Lake Elementary. Since 201, five of the elementary schools have maintained their “A” grade, two have increased a grade and 11 have decreased at least one letter. State standards have increased since 2011 with slight changes in scoring criteria. ESE, ESOL and Standard Curriculum students are all included in the student population.
- Date Posted: June 2014
- School Reading Achievement
- Indicator: 2013 FCAT 2.0 District Reading Demographic Report
- Data Source: http://appl.fldoe.org/fcatdemographics
- Data Points: Leon County Schools FCAT 2.0 Reading results show overall total students at or above state averages in all grades tested. Results included: Grade 3 at 58% achievement level (63% for Standard Curriculum only); Grade 5 at 63% (68% SD); Grade 8 at 59% (64% SED): and Grade 10 at 61% (64% SD). Black male and female and white male and female as well as individual school scores differ significantly.
- Observations: The achievement gap at Grade 3 between white non-Hispanic females (82%) and black/African American non-Hispanic females (44%) is significant. Male achievement scores are comparatively lower than females, 72% and 32% respectively, with a similar white/black student gap. Grade 5 female and male racial disparity gaps are comparable (39% and 38%) as are the Grade 8 racial differences (37% for females and 43% for males). Grade 10 results show the white male and white female achievement results closer (76% for males vs. 88% for females) and even more so for black males and females (32% vs. 33%). However, the white/black achievement gap is even wider than earlier grades between both females (47%) and male (44%) racial comparisons.
- Date Posted: October 2014
- Graduation/Dropout Rates
Loading…
- Student Absences
Loading…
- Student Suspensions
Loading…
Health
- Risk and Preventive Factors
- Death Rates
- Chronic Conditions
- Infant Mortality
- Indicator: Infant Mortality
- Data Source: Florida Chartshttp://www,flhealthcharts.com
- Data Points: Infant deaths as a percentage of live births increased from 6.8 in 2011-12 (three year average) to 7.9 in 2017-19. The statewide rate decreased over the same time period from 6.1 to 6.0. In 2017-19 the white rate was 4.1 down from 4.6 in 2011-12. The black and other rate increased from 9.3 to 11.9 at the same time.
- Observations: The contributing factors to the increase in infant deaths for black and other babies are many: maternal health, drug and alcohol use, lack of pre-natal care, and other issues. It does appear that these issues are not being adequately addressed by the community.
- Date Posted: 9/18/2020
- Low Birth Weight Babies
Loading…
- Infant Mortality
Loading…
- Teen Pregnancy
Loading…
- Older Adult
- Indicator:
- Data Source:
- Data Points:
- Observation:
- Date Posted:
- Sexually Transmitted Diseases
Loading…
- Emergency Room Visits
Loading…
- Mental Health
- Indicator:
- Data Source:
- Data Points:
- Observations:
- Date Posted:
- Adult Alcohol and Substance Abuse
- Indicator:
- Data Source:
- Data Points:
- Observations:
- Date Posted:
- Youth Alcohol and Substance Abuse
- Indicator:
- Data Source:
- Data Points:
- Observations:
- Date Posted:
- Obesity
- Indicator:
- Data Source:
- Data Points:
- Observations:
- Date Posted:
- Infectious Diseases
- Indicator:
- Data Source:
- Data Points:
- Observations:
- Date Posted:
- Access to Health Care
- Indicator:
- Data source:
- Data Points:
- Observations:
- Date Posted:
- Physicians and Hospital Beds
- Indicator: Physicians and Hospital beds per 100K
- Data Source: Office of Economic Vitality http://www.oevforbusiness.org
- Data Points: Physicians per 100 residents increased from 2009 at 240.4 to 347.3 in 2018. Over the same time period the Florida rate increased from 227.5 to 314.6. The number of hospital beds increased slightly from 2009 to 2018 from 399.6 to 416.2 while the state average declined from 321 to 308.2.
- Observations: in increase in physicians can partly be attributed to the county’s growth as a regional medical center with several underserved surrounding counties. Additionally the county and Florida physician increase reflects a growing older population needing more specialized services. The FSU school of Medicine is seeking to increase the area of family practice which locally and nationally has not seen increases matching population growth.
- Date Posted: 9/18/2020
- Health Self Reports
- Indicator:
- Data Source:
- Data Points:
- Observations:
- Date Posted:
Culture and Leisure
- Parks and Recreation Participation
- Indicator:
- Data Source:
- Data Points:
- Observations:
- Date Posted:
- Library Usage
- Indicator:
- Data Source:
- Data Points:
- Observations:
- Date Posted:
- Attraction Visits
- Indicator:
- Data Source:
- Data Points:
- Observations:
- Date Posted:
- Arts Patrons
- Indicator:
- Data Source:
- Data Points:
- Observations:
- Date Posted: